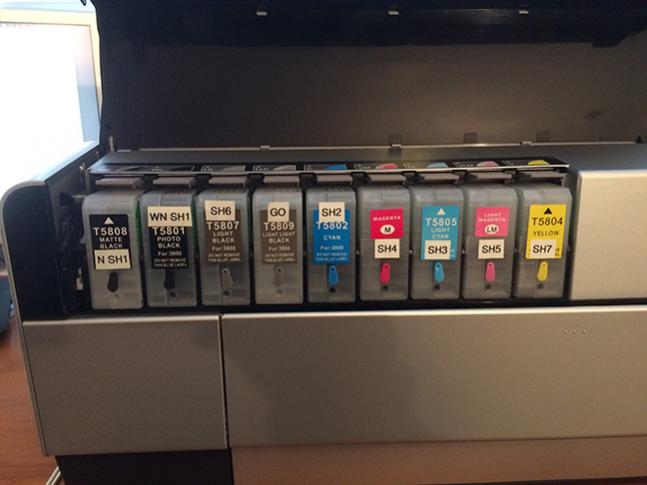
This is my first post, and I am a new Piezography user. I read the manual. I really, really did. Several times! I am getting dark prints. I have K7 Neutral inks in an Epson 3880. The printer was working fine using mostly ABW (and some color) before I converted to piezography inks a couple of weeks ago. The printer is 2 years old, and I am the only owner. Nozzle checks are good and always have been. Here is where my inks are:
[ ]
I am using a NEC PA272W monitor calibrated with SpectraView to 85 cd/m2, D50, contrast ratio 250:1, Gamma 2.20.
I am printing on JCSType5, using curve 3880-WN-SEL-NU-JCStype5, 2880 dpi, uni-directional. I use front feed exclusively to avoid pizza wheel marks.
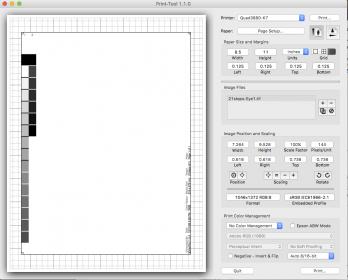
I use a Mac, OS 10.11.4 (El Capitan), and PS/LR CC2015. I use Print-Tool 1.1.0 to print.
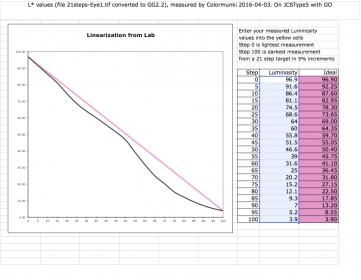
I have a Colormunki Photo, and I have measured the L* values for the ‘21steps-Eye1.tif’ both (a) printing directly in Print-Tool using the unadulterated RGB untagged [it shows up in Print Tool as having an Embedded profile sRGB IEC61966-2.1], and (b) converting it in PS to Grey Gamma 2.20, saving and then printing in PrintTool. I get the same results either way (this is after drying, applying GO using the curve 3800-3880-30000GO, using a leading strip, drying again).
So I realize I must be doing something wrong here but I am out of ideas. The linearity profile does match the darkness of my prints, so at least that appears consistent. So here I am, and hoping I can get help. Thanks, Wayne
I tried a couple of things. I ran PS CS3 on an older MacBook running 10.4.9 and printed directly from PS without color management. I got exactly the same non-linear results. As interesting as it was to configure a retro system, it did not help.
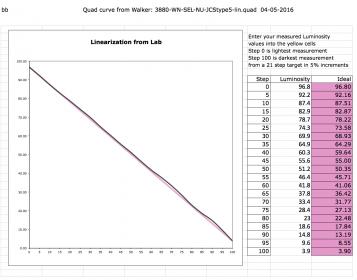
I also used Roy Harrington’s Droplet to relinearize the output of the 3880-WN-SEL-NU-JCStype5.quad curve, and while it helped it did not fully fix the issue. If anyone has any help, I would be most appreciative. Not being able to print is frustrating, but you knew that! Thank, you.
Wayne
It solved the issue. I still do not know why I get a different (worse) result when I use the QTR-Linearize-Quad.app, but that is why you work there and I don’t! Looking forward to your video.
Thanks again, Wayne
I’ll be interested to see this workflow, as I am not convinced about 51 steps and the droplet. I’ve tried it and I think it results in spurious accuracy.
If you open a cgats file you will see the column headers for L* a* and b* axis. These have to be directly above the first measurement numbers for the lin droplet to work (and this is not always the case when exported from a measurement application). If these column headers are not in the right place, the tool can miss-represent the last few numbers of the (shadow values) of the measurements. It will also default to sampling only 16 of the patches so you won’t be utilizing all of your available data.
Attached is a measurement file from Measure Tool. This is from the x880 P2 Spec Edition Curve for HPR. (Actually the curve was remapped for the R1900, but for these purposes that’s not really relevant - you could also use these numbers to relinearise the original curve.)
What’s wrong with the measurement file? If I use these numbers to relinearise the curve, I get a beautiful straight line. Where’s the problem? Do you really think that the droplet is using only a subset of the measurement data?
This is a tab delimited file, so the Lab_L numbers are in the same tab delimited column as the header label.
There are two reasons why I have difficulty in accepting that these three are problems - (i) Roy hasn’t said any such thing that I’ve read anywhere (his initial post says that “… and a measurement file i.e. .txt file like the usual QTR-Linearize-Data takes …”, and back in the day when all we had was Measure Tool, this was the measurement format used); and (ii) the droplet works and produces consistent results for me.
Why don’t you post a CGATS file that you consider to be correctly formatted, and then we can test whether or not using that format makes any difference.
You do realise that this is the measurement of a 21x4 chart, hence the 84 readings?
There are known bugs in how QTR Quad Linearizer handles Lab_L column header and data from i1Profiler Lab* CGATS exports. (please read above comments about that)
This is beta but please use this and get back to me on the results.
(The i1Profiler i1Pro2 targets will work with the Spyder and single-patch reads FYI.)
ColorMunki 21,51,129 random targets are coming (with added “de-randomizer” spreadsheet) but these are real manual targets that require hand-crafting. We do them at 720dpi.
Please read the instructions/disclaimer included in the link above. No support yet until it’s validated.
“I’ll be interested to see this workflow, as I am not convinced about 51 steps and the droplet. I’ve tried it and I think it results in spurious accuracy.” You should try it. We do up to 129 right now and also 256 (with some error correction of the measurements).
If 21x4 is working for you then good. Sorry, I was thinking for some reason you were working off a different set. 21x4 are supported by his organizing code inside the droplet.
I’ve directly observed bugs with start of measurement data not correctly identified by the droplet but identified by create-icc.